
by erick.castillo | Dec 15, 2022 | Entretenimiento, Música
Vivir como cholo, vestir como cholo y actuar como un completo homie, es algo que no existiría hoy en día de no ser por artistas como Down A.K.A. Kilo. Pregúntale al primo que te acercó al sendero de la música o a ese amigo que dice ser un conocedor del rap y el hip...

by erick.castillo | Dec 14, 2022 | Uncategorized
Play 297. “Pocho” Guzmán, ¿una necesidad para Chivas? [social-share facebook_enabled=”yes” facebook_order=”1″ twitter_enabled=”yes” twitter_order=”2″ whatsapp_enabled=”yes” whatsapp_order=”3″...

by erick.castillo | Dec 14, 2022 | Entretenimiento, Música, Notas Superestrella
Lo que está pasando con la música es inaudito. En los 90, cuando agrupaciones como Backstreet Boys o NSYNC eran las máximas estrellas del mundo, y por su parte el regional era representado por íconos como Joan Sebastian o Bronco, nadie se iba a imaginar que algún día...

by erick.castillo | Dec 14, 2022 | Celebridades, Entretenimiento
Nueve meses después de la polémica que desató su entrevista con Luis de Llano en la que se habló sobre la relación que el productor mantuvo con Sasha Sokol cuando ella aún era menor de edad, Yordi Rosado se sinceró en su mismo programa de YouTube resaltando que en ese...
by erick.castillo | Dec 13, 2022 | Cine, Entretenimiento
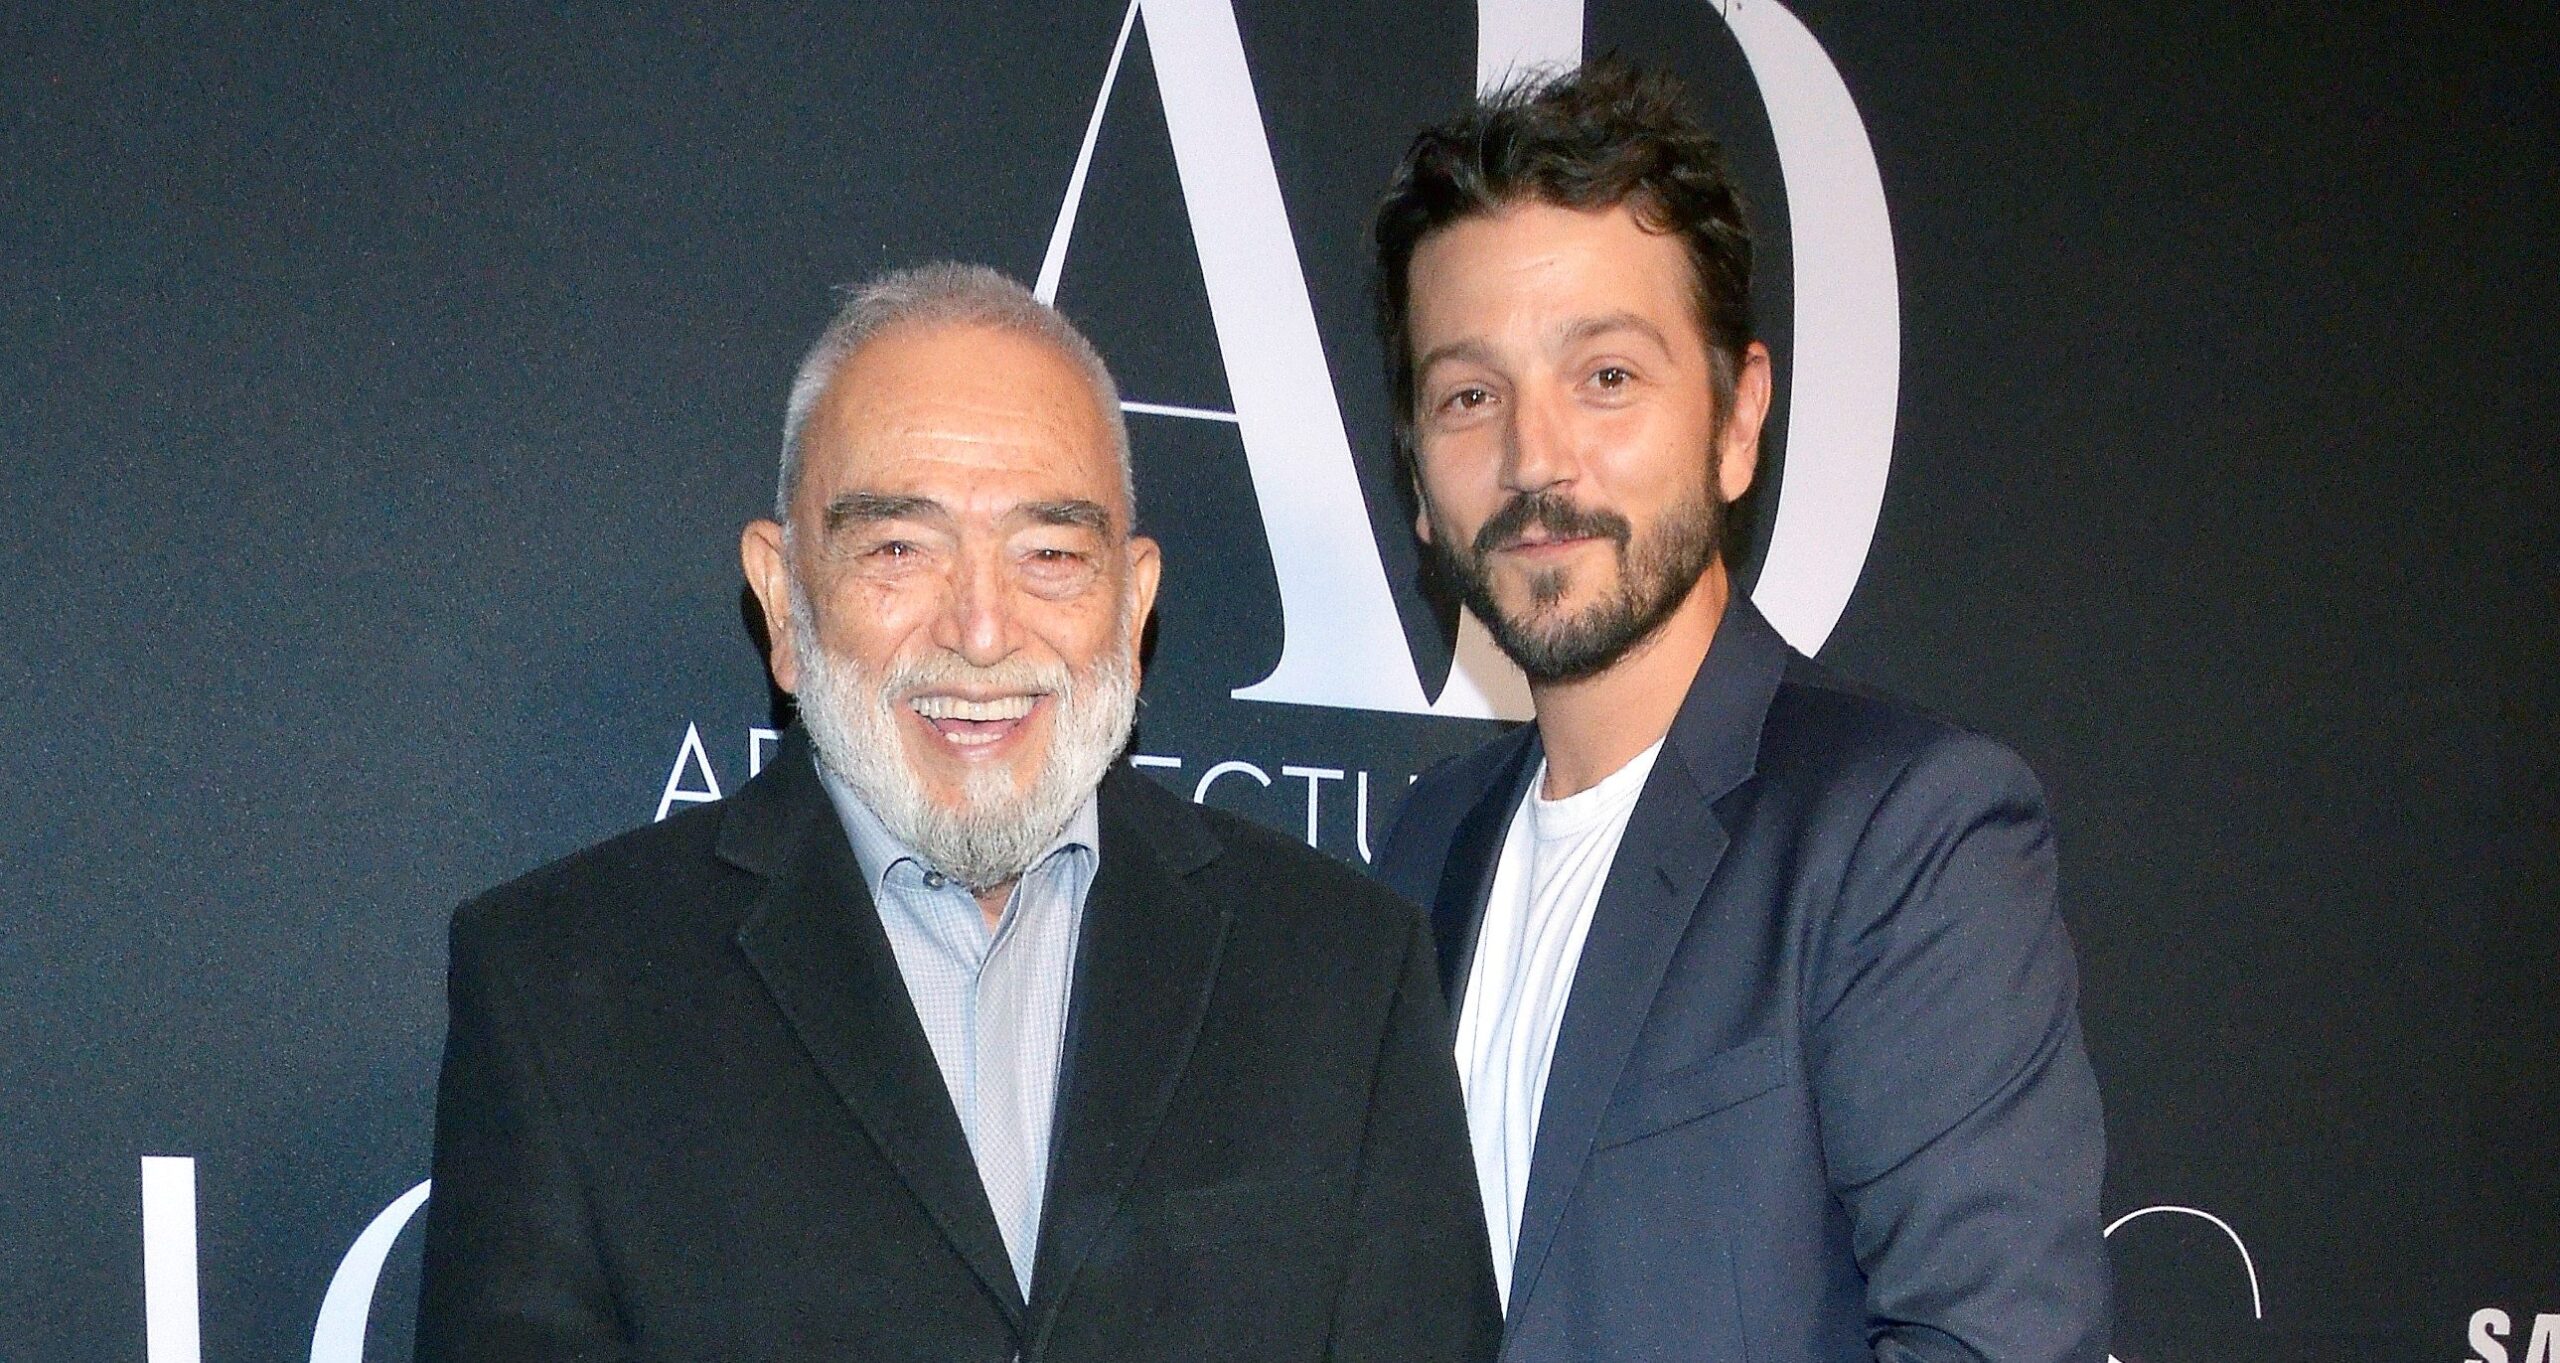
La familia de Diego Luna está atravesando uno de los momentos más difíciles de su vida, pues el día de hoy se dio a conocer que su padre, Don Alejandro Luna Ledesma, ha fallecido. Fue la revista Quién la que informó sobre el lamentable deceso del padre del actor, pero...
by erick.castillo | Dec 13, 2022 | AdTech & Digital Operations, Programmatic Ad Networks
SANTA MONICA, Calif.–(BUSINESS WIRE)– Smadex, an Entravision company (NYSE: EVC), is delighted to welcome Phil Gontier as Chief Revenue Officer. Phil joins Smadex following six years of leading Liftoff to become one of the largest global programmatic ad...

by erick.castillo | Dec 12, 2022 | Entretenimiento, Música
El pasado viernes 9 y sábado 10 de diciembre, el concierto de Bad Bunny tuvo lugar en el Estadio Azteca de la Ciudad de México, y se convertiría tanto en el evento más esperado del año, como uno de los más importantes del país en décadas. La Ciudad de México colapsó...

by erick.castillo | Dec 12, 2022 | Uncategorized
Play 296. Solo fichajes mexicanos: ¿Nuevo ADN en América y Rayados? [social-share facebook_enabled=”yes” facebook_order=”1″ twitter_enabled=”yes” twitter_order=”2″ whatsapp_enabled=”yes”...

by erick.castillo | Dec 9, 2022 | Uncategorized
Play 295. Con Europa y fichajes, Chivas busca resurgir [social-share facebook_enabled=”yes” facebook_order=”1″ twitter_enabled=”yes” twitter_order=”2″ whatsapp_enabled=”yes” whatsapp_order=”3″...

by erick.castillo | Dec 9, 2022 | Entretenimiento, Música, Uncategorized
Se cumplen 10 años del fallecimiento de Jenni Rivera, la máxima exponente del regional mexicano y la banda, quién perdió la vida en un accidente aéreo. Jenni fue la predecesora de las mujeres en el regional, un género en el que los hombres mandaban y no había apertura...